
Automated radial intensity profile analysis of halogen distribution in black coral XRF elemental maps
The purpose of this workflow is to automate the extraction and processing of radial intensity profiles from XRF elemental maps of black coral skeletons. The workflow applies identical radial ROIs to all elemental maps, performs background subtraction and normalization, and exports a single CSV file for downstream analysis.
Software
- Fiji (ImageJ)
- Python
Workflow
- Export each elemental map (Br, I, etc.) as an individual TIFF image.
- Open all elemental maps belonging to the same sample in Fiji.
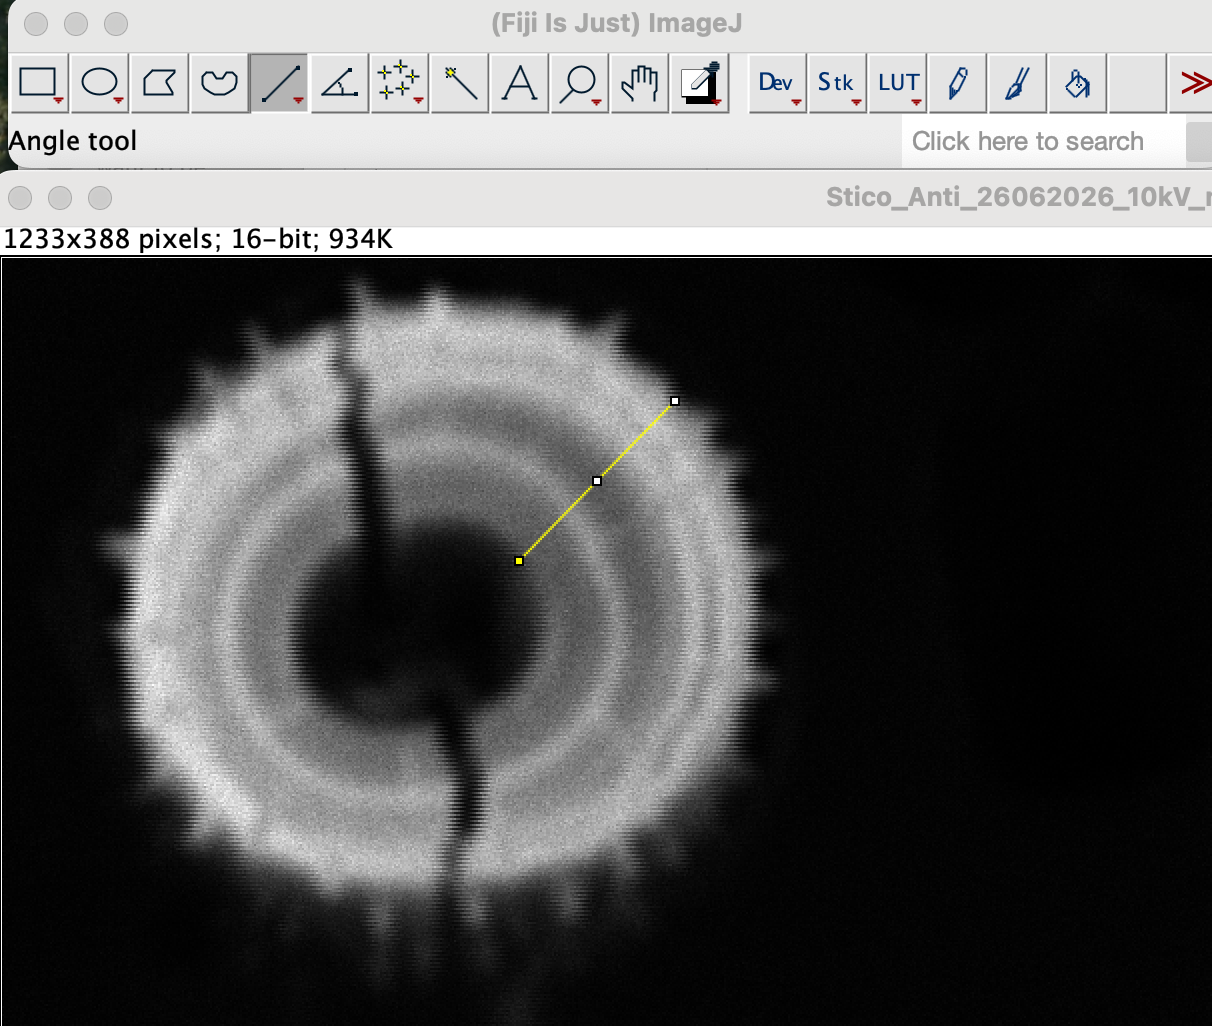
- Draw radial line ROIs from the edge of the inner canal toward the outer cortex.
- Draw one additional ROI in a background region outside the specimen.
- Save all ROIs using the ROI Manager.
- Run the Fiji macro.
- The macro automatically:
- applies the same ROIs to all elemental maps;
- measures the background intensity;
- subtracts the background from every profile;
- normalizes radial distance (0–1);
- normalizes intensity (0–1);
- exports all measurements into a single CSV file.
- Import the CSV into Python for visualization and statistical analysis.
ROI selection
The same radial ROIs must be applied to every elemental map from the same sample to ensure that all intensity profiles are extracted from the identical anatomical position.
Each radial line was drawn from the edge of the central canal toward the outer cortex using the Straight Line tool in Fiji. A background ROI was drawn outside the specimen to estimate the background signal.
The ROIs were stored in the ROI Manager (Analyze → Tools → ROI Manager) by clicking Add, and then saved (More → Save…) as a .roi file. The saved ROI set was subsequently loaded (More → Open…) and applied to all elemental maps of the same sample.
Fiji macro
The Fiji macro used for this workflow is available in:
Files/Scripts/Fiji/Export_Radial_Profiles_all_channels_normalized_bgsub.ijm
The macro automatically applies the saved ROIs to all elemental maps and exports a single CSV file containing the extracted radial intensity profiles.
Macro output
For every radial ROI and elemental map, the macro exports:
- image (element)
- ROI number
- distance (pixels)
- normalized radial distance
- raw intensity
- mean background intensity
- background-corrected intensity
- normalized intensity
All measurements are exported into a single CSV file.
Automated processing
For each elemental map, the macro automatically:
- applies the identical radial ROIs;
- measures the mean background intensity;
- subtracts the background from every radial profile;
- replaces negative values after background subtraction with zero;
- normalizes radial distance from 0 (central canal) to 1 (outer cortex);
- normalizes background-corrected intensity to the maximum value within each individual profile.
This workflow minimizes user-dependent variability and ensures identical sampling locations across all elemental maps.
Downstream analysis
The exported CSV file was imported into Python for plotting and statistical analysis. Radial intensity profiles from different elements (e.g., Br, I and Cl) were compared using the normalized radial distance and normalized intensity values.
```